 Christian Beatty
"Reports take two days each month." The owner of a local SEO agency told me this. Each month, a person opens Search Console, then Google Analytics, then the Business Profile of the client. The person copies the numbers into a document. Then the person does the same work for the next client.
The numbers are the slow part of the report, but they are not the valuable part. The client expects three answers: what changed, what the agency did, and what comes next. When the team uses all its time on the numbers, the summary is short and the report is late.
This post shows the reporting system that I built for this agency, which has approximately 85 clients. The system pulls the Search Console, GA4, Business Profile, and Local Services Ads numbers for each client each month. It puts them next to the completed work. The post also shows what a person must still write, and how AI writes the first draft of the summary.
Why reports take so long
The problem is not slow staff. The problem is that the data for one report is in five or more tools. The draft SOP of the agency lists Search Console, GA4, Google Business Profile, Local Services Ads, and a rank tracker. For each tool, a person must open the account of the client, select the correct dates, and copy the numbers.
The SOP gives 30 to 45 minutes for each client only to collect the data. Many small problems occur in this process:
Each person selects the dates by hand. A wrong date range gives wrong numbers.
The person compares the numbers with last month by hand.
The list of completed work is in a different tool. The person must find the work for each client.
Nobody sees when a report is late. The first sign is often an email from the client.
The solution is to remove the copy work and keep the human work.
One Google account reads the data of all clients
The system uses one agency Google account. The owner connects this account one time on the Integrations page of the platform. The access to GA4 and Search Console is read-only.
For each client, the agency adds this account to the GA4 property with the Viewer role. It also adds the account to the Search Console property with the User role.
Link each client to its properties
The Integrations page has two buttons for the owner. The first button is "Find properties and link clients by website." This button does these tasks:
It lists each GA4 property and each Search Console site that the agency account can see.
For each GA4 property, it reads the website address of the web data stream.
It compares each address with the website and the domains on the client record.
It links a client to a GA4 property only if exactly one property matches.
For Search Console, it prefers a domain property, because a domain property includes all versions of the site.
The button does not change a client that already has a link. If the button finds no match, the owner selects the property on the Connections tab of the client. If the agency account loses access to a property, the Connections tab tells the owner. The owner then asks the client for access again.
What the system pulls, and when
The table shows the numbers that the system saves for each client and each month.
Source | Numbers |
|---|---|
Search Console | Clicks, impressions, click-through rate, and average position for the month. The top 10 searches and the top 10 pages for the newest month. |
GA4 | Sessions, total users, new users, engaged sessions, and key events. Sessions and key events for each traffic channel. The count of each type of key event, for example a form or a call. |
Business Profile and Local Services Ads | Calls, leads, and spend for the month. |
The job runs on the 4th, not on the 1st
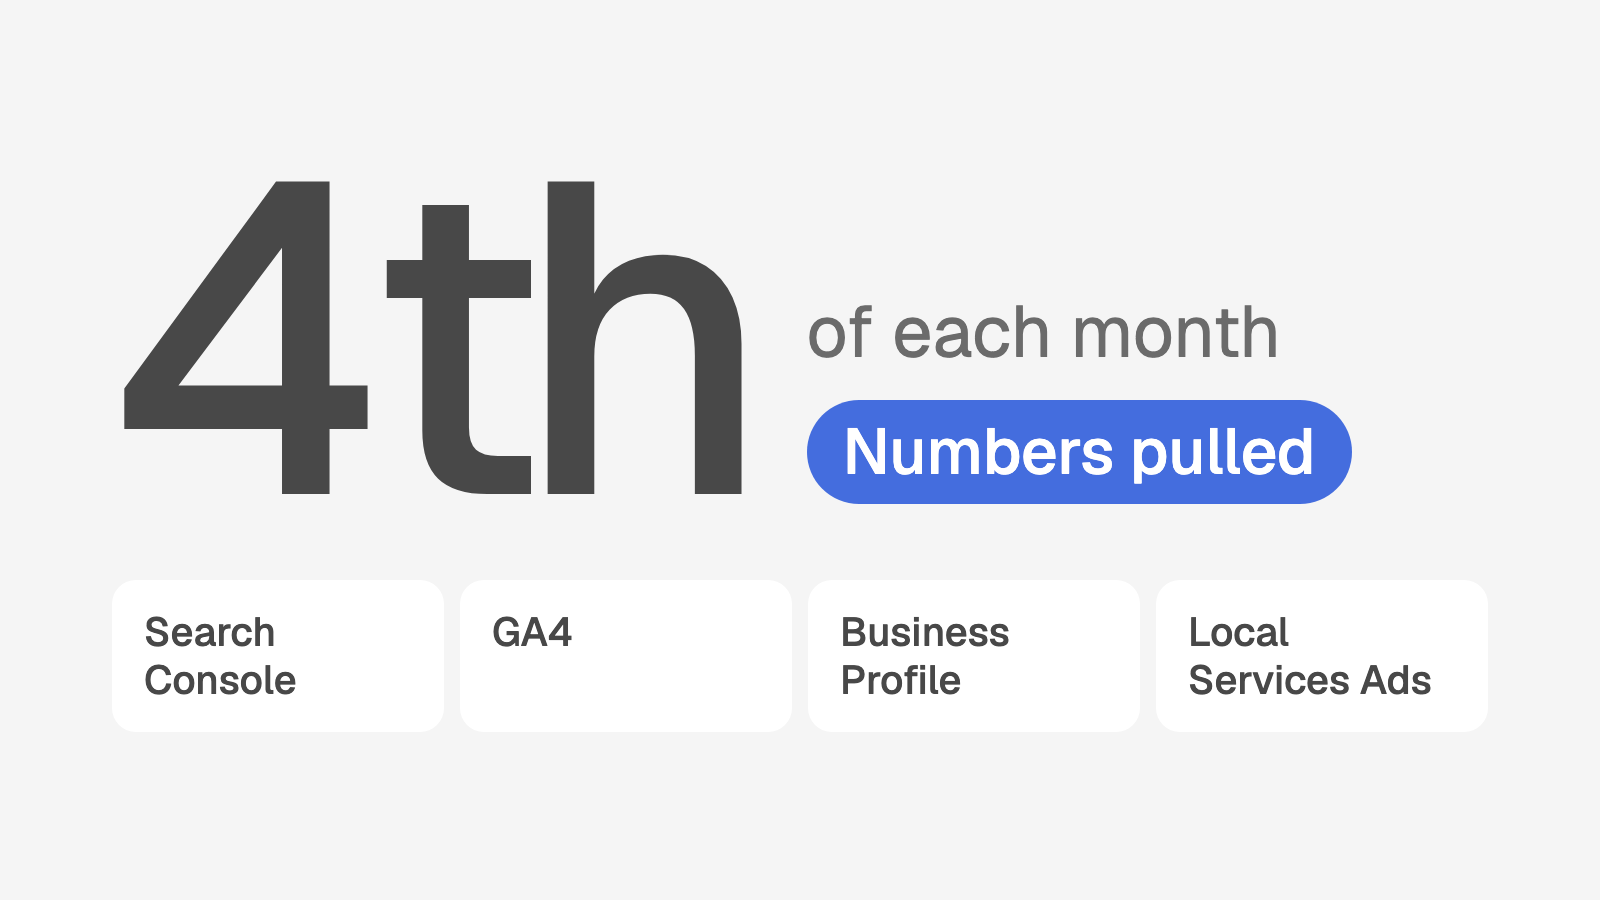
A scheduled job runs on the 4th of each month. Search Console data settles approximately three days after the month ends. A pull on the 1st can show numbers that are too low.
The job pulls the last two completed months, not only the last month. If Google corrects the numbers for the month before, the system also updates them. The system saves one row for each client, month, and source. A second pull replaces the row and does not add a duplicate.
The job reads four clients at a time, to stay below the limits of Google. If one client fails, the job continues with the next client and records the failure.
The second button on the Integrations page pulls the last 16 months of results. Search Console keeps 16 months of data. Because of this, a new client can show more than one year of history on the first day.
What the account manager sees: the Results tab
Each client record has a Results tab. At the top, the tab shows six numbers for the newest month. Each number shows the change from the month before, as a percentage with an up or down arrow.
Number on the tab | Source |
|---|---|
Clicks from Google search | Search Console clicks |
Times shown in Google | Search Console impressions |
Average Google position (a lower number is better, so a decrease shows as an improvement) | Search Console position |
Website visits | GA4 sessions |
Visits from Google search | GA4 sessions from Organic Search |
Website leads (0 until someone sets up key events in GA4) | GA4 key events, such as forms and calls |
Below the numbers, the tab shows the work completed in the same month. This is a list of each deliverable that the reviewer approved in that month, with a link to the deliverable. The tab also shows leads by type, traffic channels, top searches, top pages, and a table of all months.
The list of work is important. The client does not see the work of the agency. The client sees only the results. When the report puts the work next to the results, the client can connect the two.
The report is a deliverable with an owner and a due date
The monthly report is also a deliverable in the work queue, the same as a blog post. The system creates one "Monthly report" deliverable each month for each current client that has the report in its services. Each deliverable has a person who does the work, a reviewer, and a due date. The due date is a fixed day of the month, or the billing day of the client.
The deliverable moves from "To do" to "In review" to "Approved." The person adds a link to the report as proof. I described this rule in one owner, one due date, one proof.
The job that creates the monthly deliverables runs on the 1st of each month. It does not create deliverables for services that a client does not have.
A late report is a risk signal
A client with no report thinks that the agency did no work. Because of this, a late report is a risk, even when the work was done.
In the current risk score, an overdue "Monthly report" deliverable counts as an overdue deliverable, the same as any other deliverable. One or two overdue deliverables give 15 points. For the full list of signals, read how to find clients who will cancel.
The risk score also has a separate report signal, from the health plan of the agency:
Green: the team sent the report by the report day.
Yellow: the report is 1 to 7 days late.
Red: the report is 8 or more days late, or the team missed it two times.
The risk score also has a results trend signal from the same plan. A decrease of more than 25 percent for two months is red. The signal also uses the Business Profile and Local Services Ads data.
What the numbers cannot write
The system removes the copy work for Search Console, GA4, Business Profile, and Local Services Ads. The numbers do not write the report. In the SOP of the agency, these parts of the report stay with a person:
A plain summary. What changed this month, and why.
The work done, with proof. The Results tab gives the list. A person tells the client why each item is important.
Open items. What the agency waits for from the client, for example access, an approval, or content.
The plan for next month. What the team will do, and what result the team expects.
The summary is the hardest part. A decrease in clicks can come from the season, a Google update, or a problem on the site. Only a person who knows the client can say which cause is correct.
The client record has fields for the Business Profile location and the Google Ads customer ID for Local Services Ads. The system uses these fields to pull calls, leads, and spend from these sources. The team adds the rank tracker data by hand.
How AI helps with the summary
The platform runs on rules, integrations, and scheduled jobs. It also uses AI for the monthly summary, because the inputs are in one place.
An AI model reads the numbers for this month and last month, the list of approved work, and the open items. It writes the first draft of the summary. The account manager edits the draft and approves it. A person always sends the report.
The order is important. First, the data must be correct and in one place. If an AI model reads numbers that a person copied with errors, the summary has the same errors.
Start this week with a spreadsheet
You can remove much of the copy work without new software:
Make a list of each client that receives a report. Add a column for the report day.
Make one agency Google account for reporting.
Add this account to the GA4 property (Viewer) and the Search Console property (User) of each client.
Make a spreadsheet with one row for each client and one tab for each month.
Add these columns: clicks, impressions, average position, sessions, and key events.
On the 4th, copy the numbers for the full previous month into the new tab.
Add a column with the change from last month, as a percentage.
From your project tool, copy only the completed work that has a link.
Write three sentences for each client: what changed, why, and what is next.
Record the date that you sent each report.
Each Monday, find the reports that are late.
The spreadsheet still takes time. But the dates are the same for all clients, and the comparison is ready. When this process works, make the pull automatic.
How does your agency score?
Delivery accountability is one of eight areas in the free agency systems quiz. The quiz has 14 questions and takes 5 minutes. You receive a score out of 100 and your three largest gaps.
Take the 5 minute quiz. Or book a call, and I will show you how a system like this can work in your agency.